
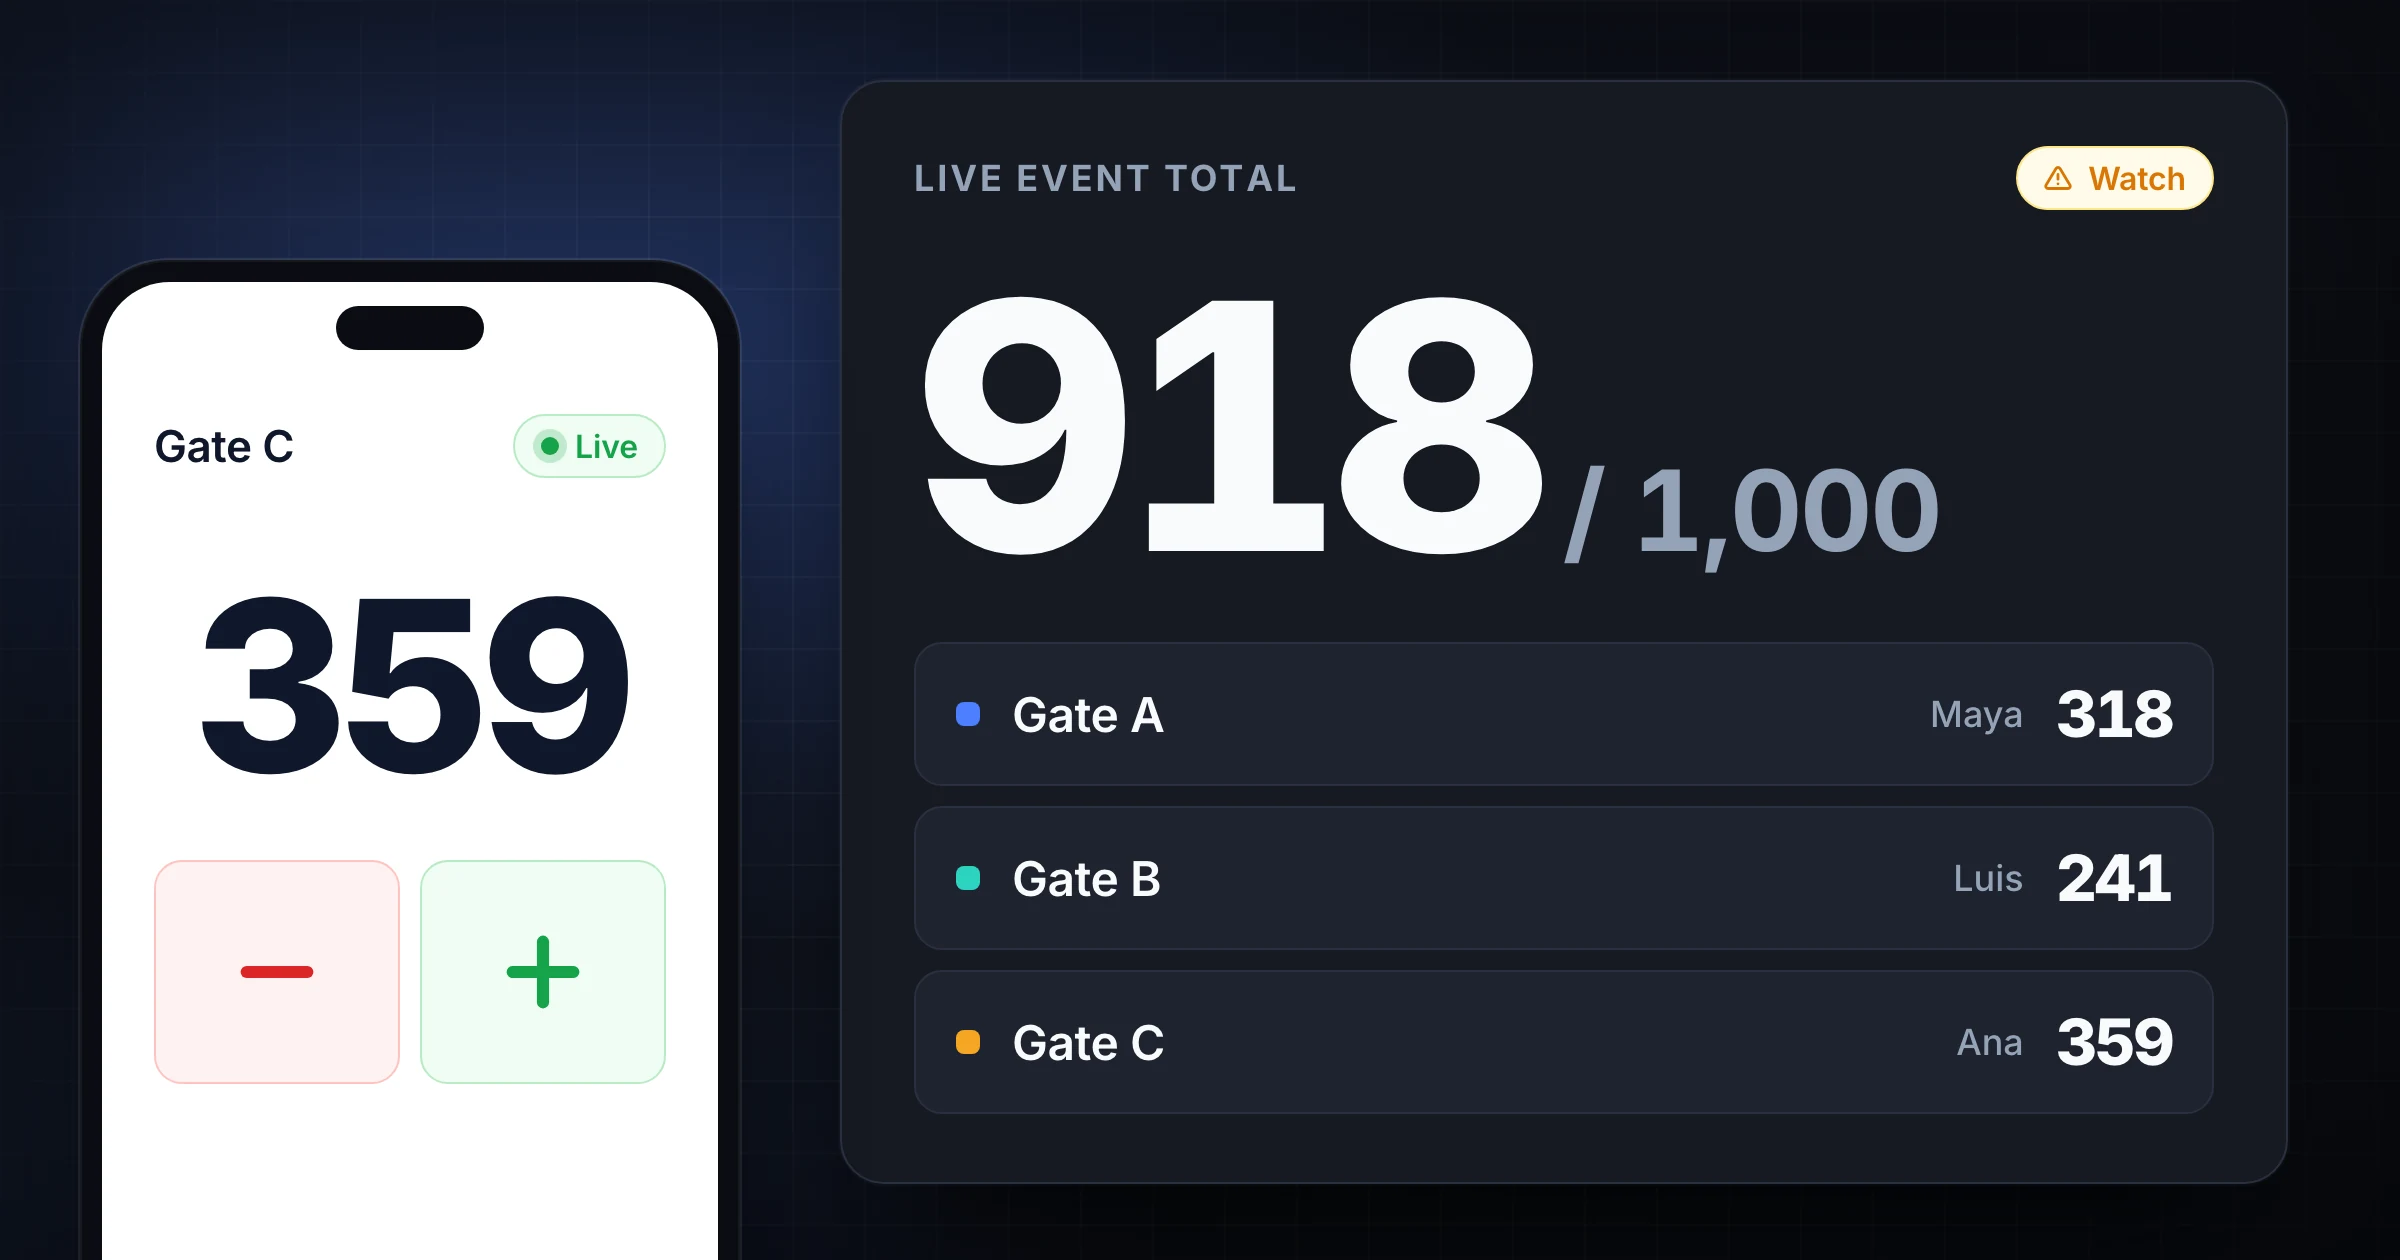
Event Headcount: Counting at Multiple Gates
Run event headcount across multiple gates without losing the total. Use clear roles, live sync, capacity checks, and reconciliation after doors close.
EventsSnapCount Team
How-tos, comparisons and field notes on retail foot traffic, paper tally sheets, cycle counting, event headcount, and turning manual counts into shared team workflows.
29 articles
Run event headcount across multiple gates without losing the total. Use clear roles, live sync, capacity checks, and reconciliation after doors close.
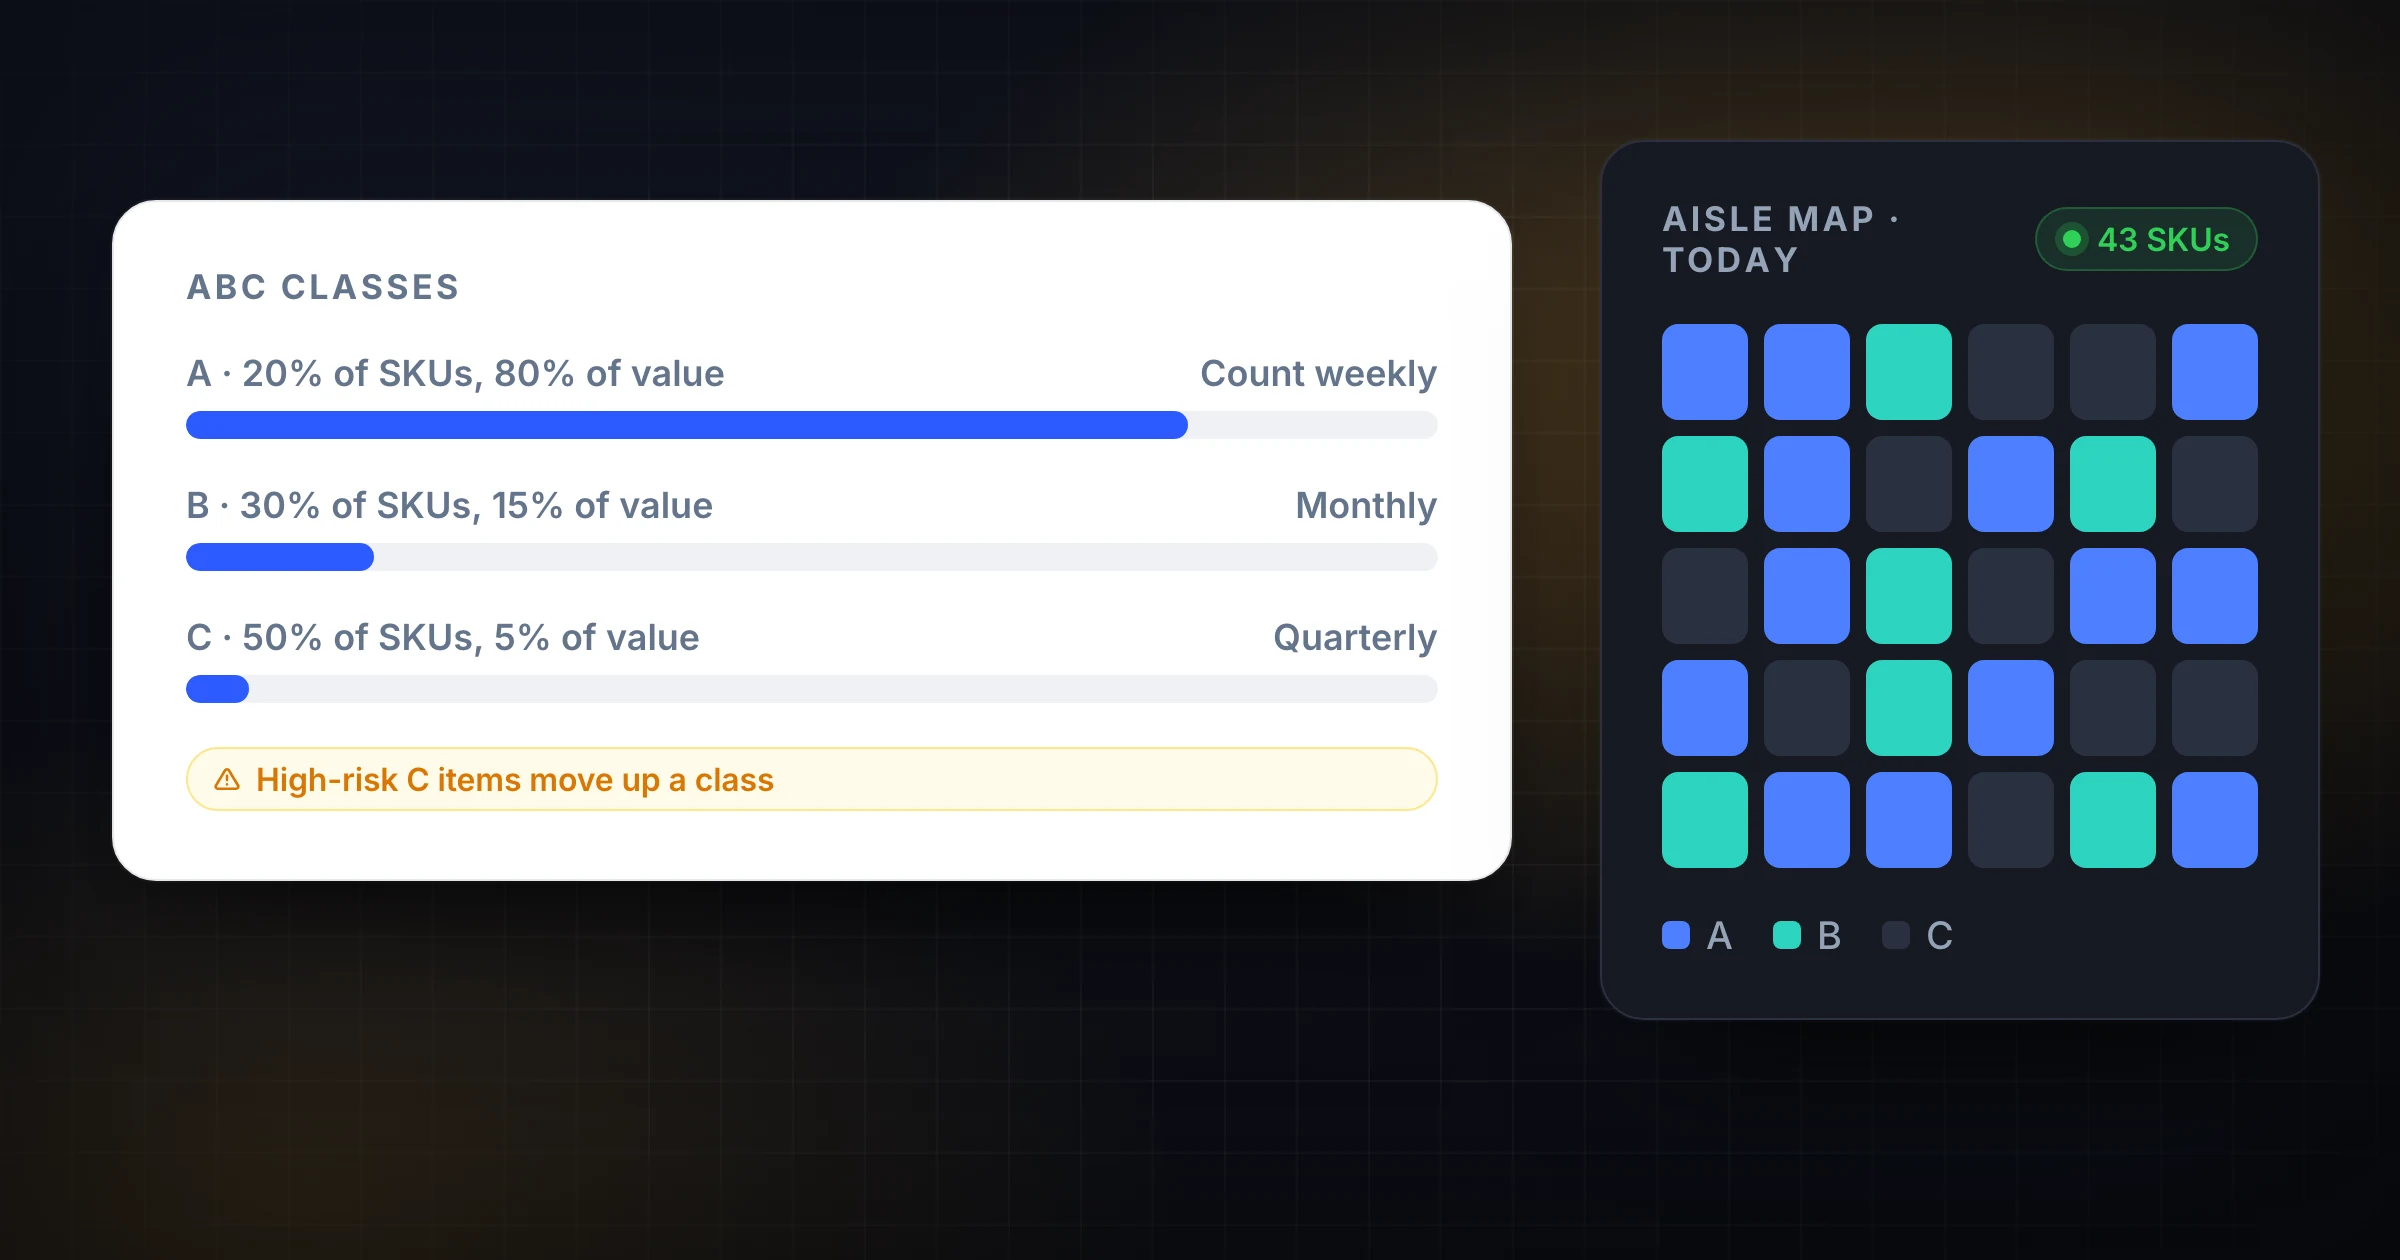
Use ABC analysis in cycle counting to count high-value SKUs more often, reduce inventory variance, and build a warehouse schedule your team can finish.
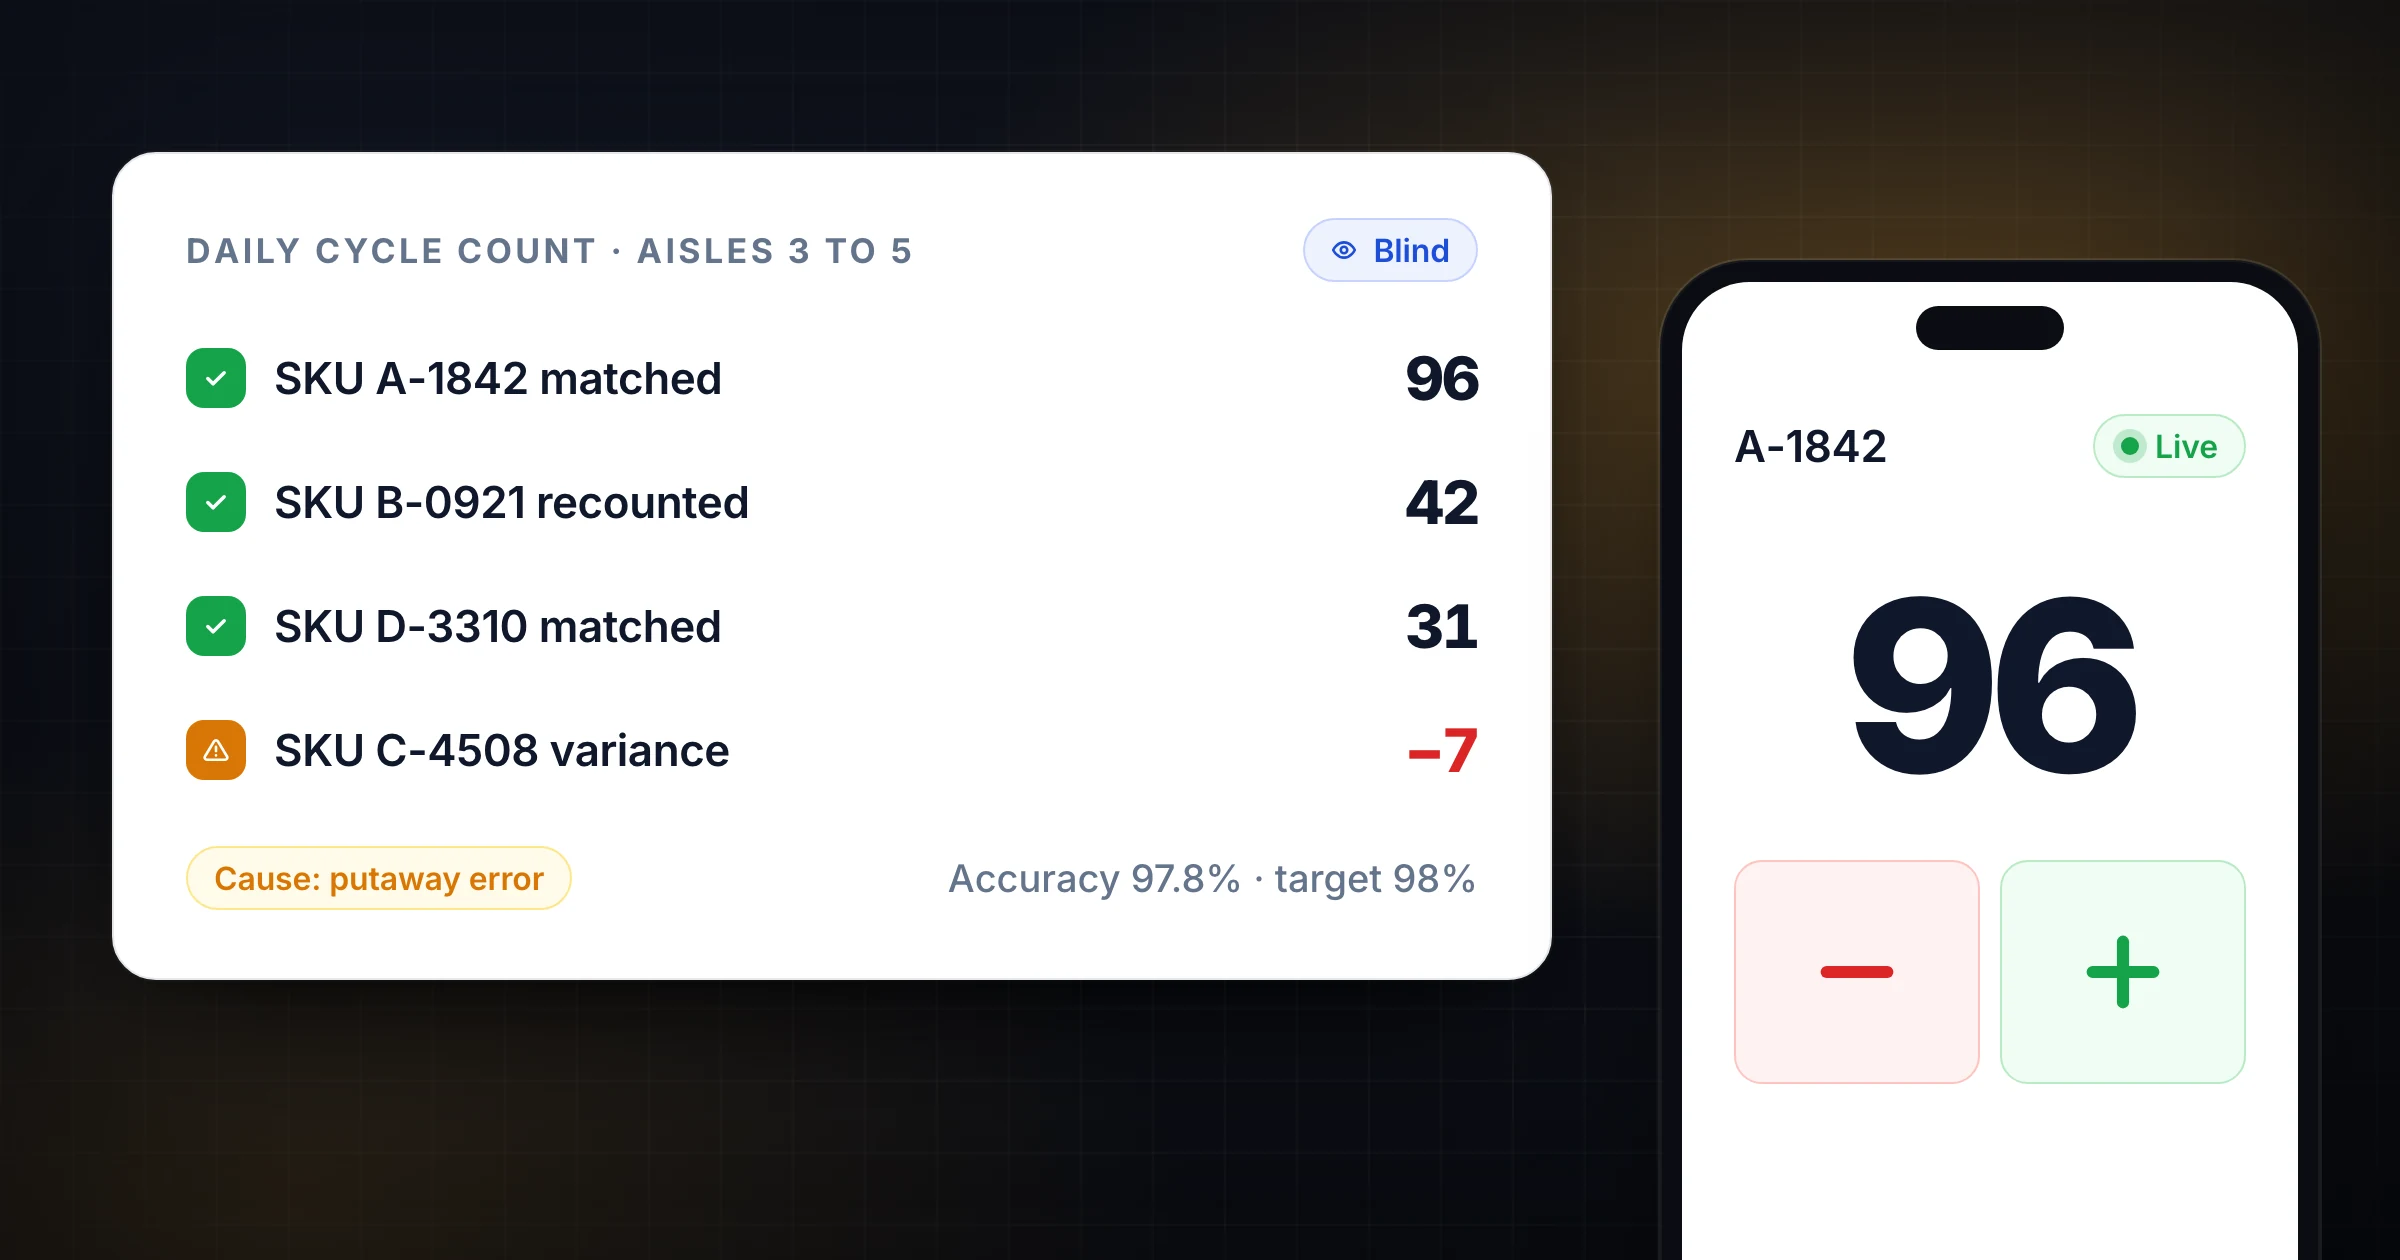
A cycle counting playbook for warehouse managers: scheduling, blind counts, variance review, accuracy targets, and the daily habits that keep stock right.
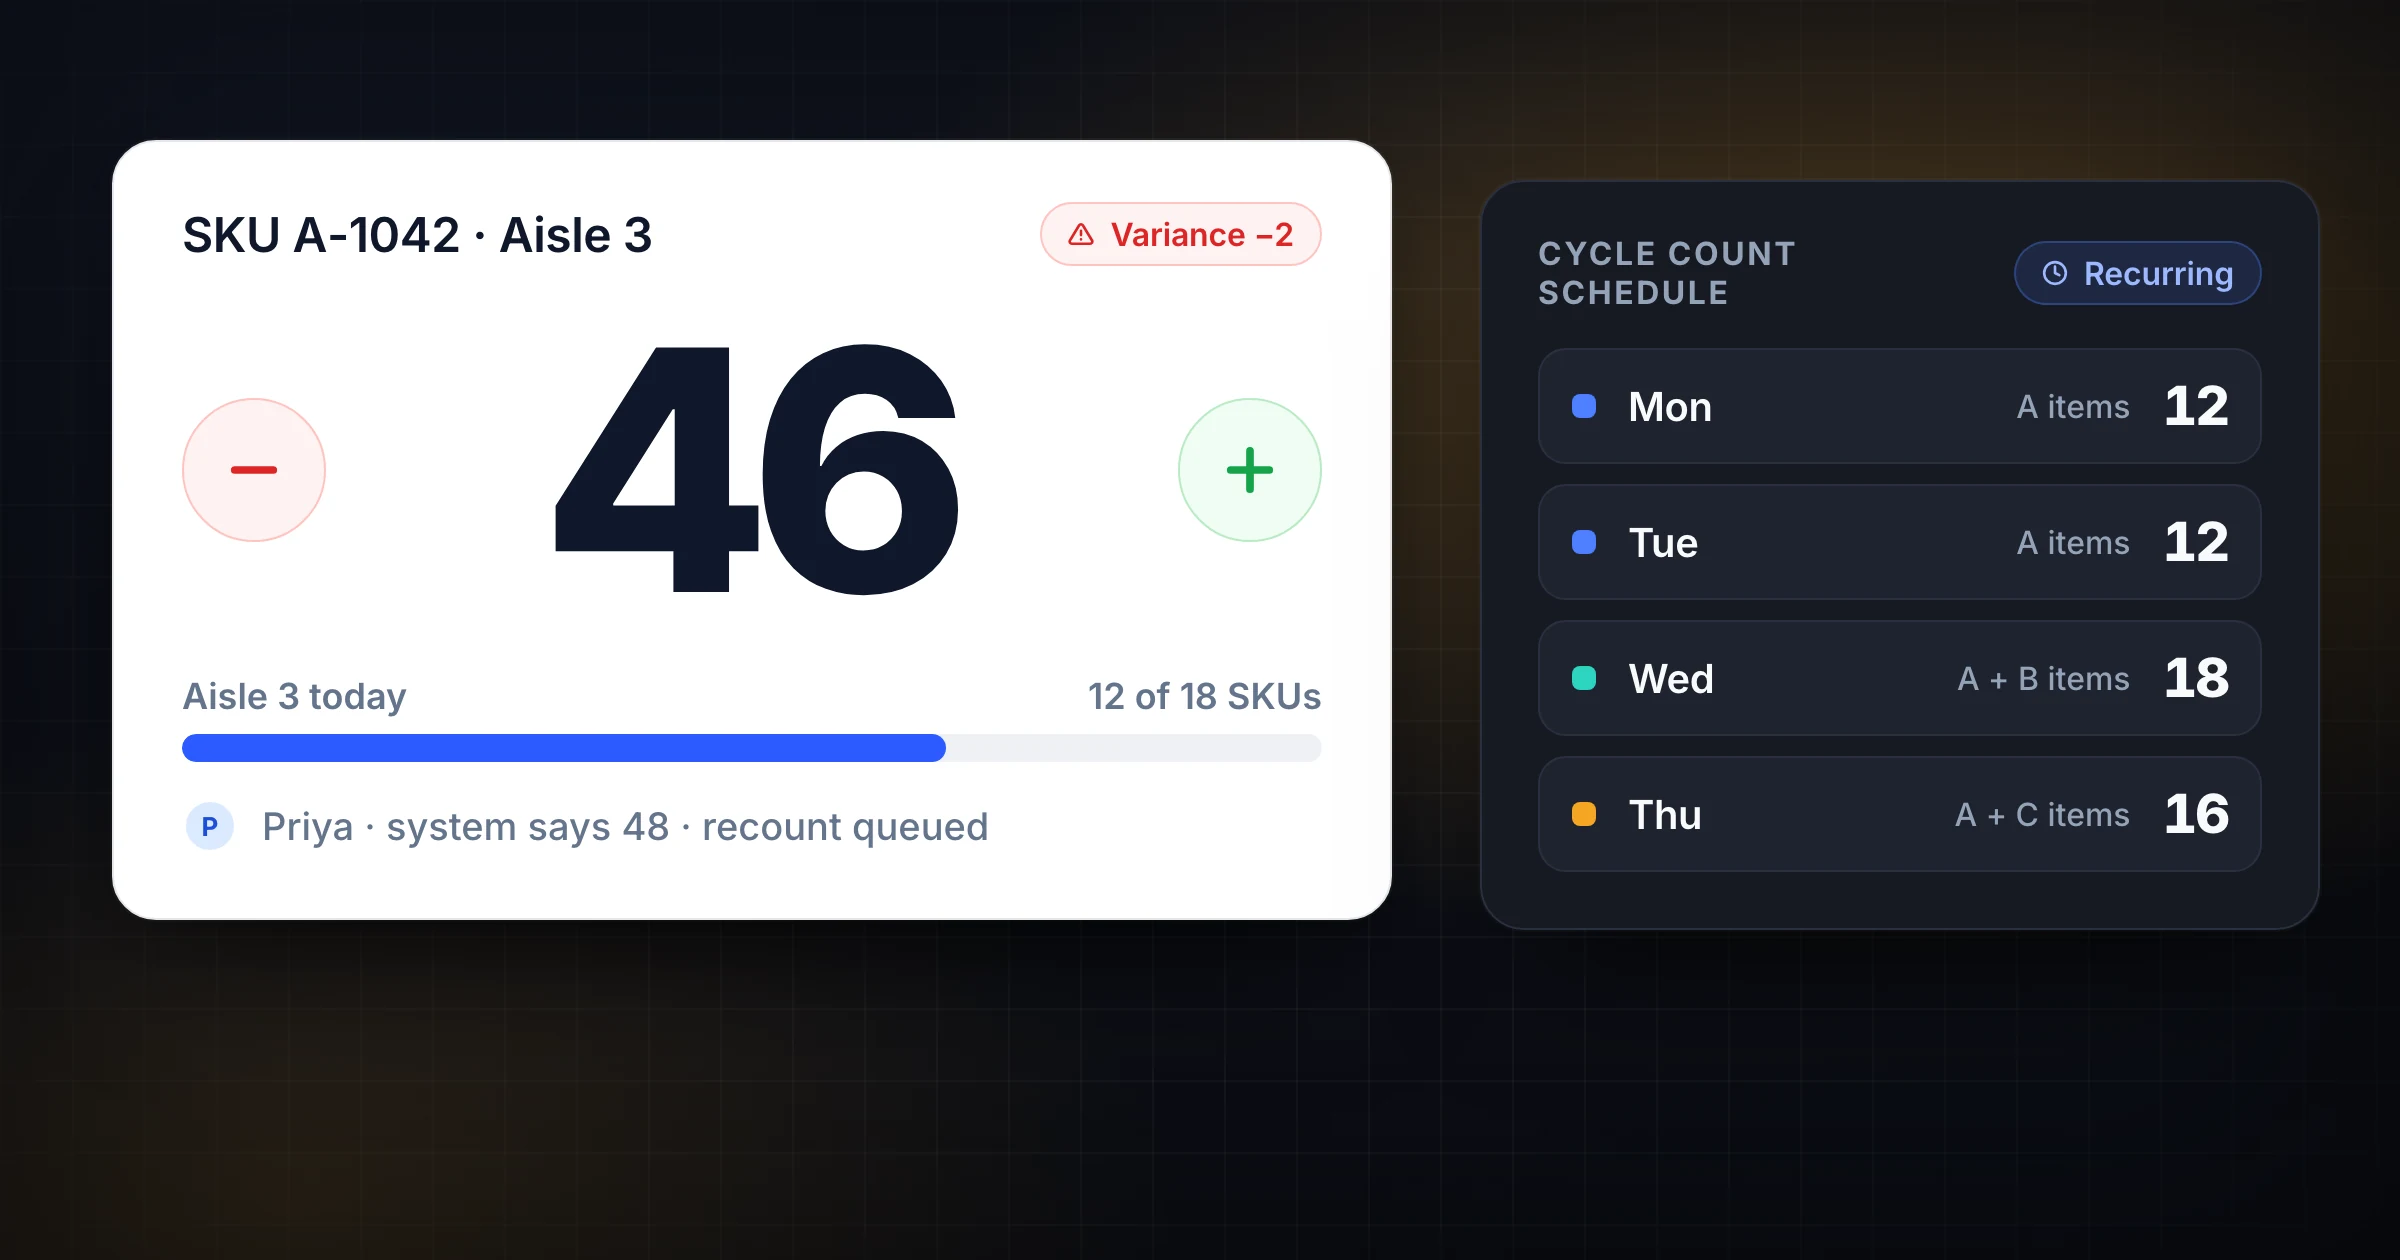
Cycle counting is a recurring inventory audit where teams count a scheduled set of SKUs. Learn the definition, procedure, methods, frequency, and examples.