
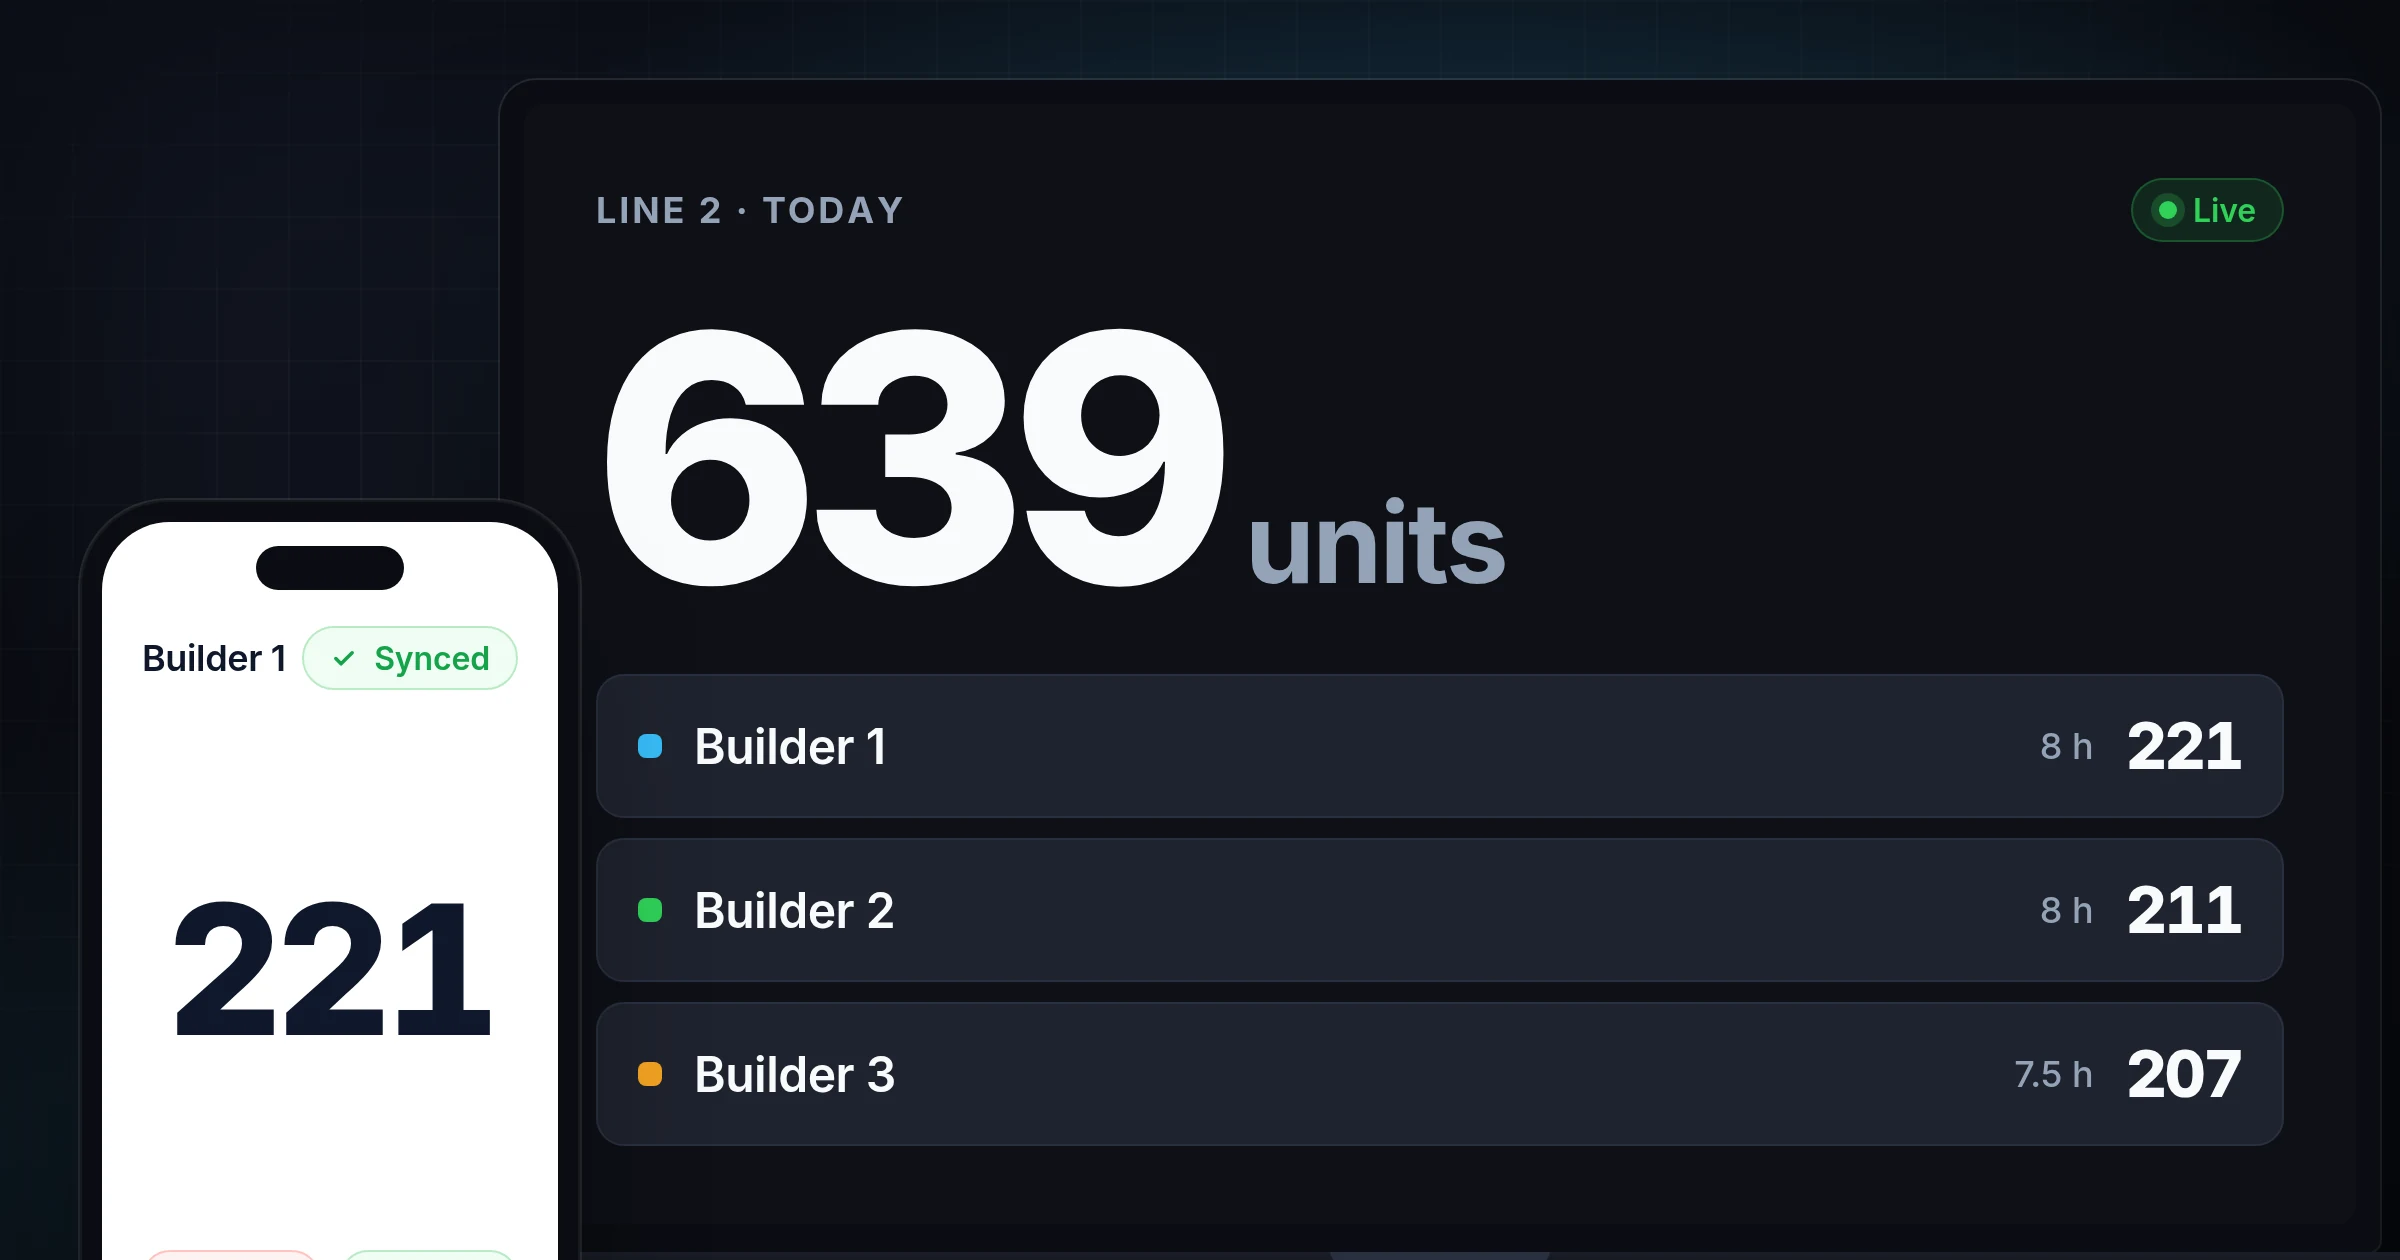
Short answer: a daily production report records what each worker or line produced that day, against the target, with the problems that got in the way. The core fields are the date and shift, units produced per worker and per product, the target, rejects or rework, downtime with its reason, and a sign-off. Copy the template below, or skip the paperwork by counting live on phones so the report is already added up when the shift ends.
This template is for manufacturing floors, yards, packing lines, and other hands-on operations where people count what they make. (Film and TV crews use a different "daily production report"; this is not that one.)
What a daily production report is for
The daily production report is the number someone above you asks for: the owner, the plant manager, or head office. It answers four questions:
- How much did we make today, per product?
- Who made it, per worker or line?
- Did we hit the target, and if not, why not?
- What needs fixing tomorrow: a machine, a material shortage, a staffing gap?
A production log is the running record behind it: every entry through the day, often by time. The daily report is the log added up and signed off. A shift report is the same report cut at shift change instead of at the end of the day.
The daily production report template
Copy this into a spreadsheet, a document, or a clipboard. Keep one row per worker (or line) and one column per product or grade.
Header
| Field | Example |
|---|---|
| Date | Tuesday, October 13 |
| Shift | Day shift, 07:00 to 15:00 |
| Site or line | Line 2 |
| Supervisor | J. Ortiz |
| Workers on shift | 6 |
Output per worker
| Worker | Product A | Product B | Product C | Total units | Rejects or rework | Hours worked |
|---|---|---|---|---|---|---|
| Total |
Target and variance
| Product | Target | Actual | Variance | % of target |
|---|---|---|---|---|
| Product A | ||||
| Product B | ||||
| Product C |
Downtime and issues
| Start | End | Minutes | Reason | Action |
|---|---|---|---|---|
Notes and sign-off: material shortages, safety notes, what changes tomorrow, supervisor signature.
Want a sheet for the floor to mark during the shift? Make one in the free tally sheet generator with a row per worker and product, such as "Builder 1 A's", then print the tally marks and totals or download them as CSV.
A filled example
Here is the same report for an illustrative pallet yard day, where "products" are pallet grades.
| Builder | A's | B's | Combo | Total | Rework | Hours |
|---|---|---|---|---|---|---|
| Builder 1 | 142 | 61 | 18 | 221 | 4 | 8 |
| Builder 2 | 128 | 74 | 9 | 211 | 2 | 8 |
| Builder 3 | 97 | 88 | 22 | 207 | 6 | 7.5 |
| Total | 367 | 223 | 49 | 639 | 12 | 23.5 |
| Product | Target | Actual | Variance | % of target |
|---|---|---|---|---|
| A's | 400 | 367 | -33 | 92% |
| B's | 200 | 223 | +23 | 112% |
| Combo | 50 | 49 | -1 | 98% |
Illustrative numbers, not customer data. For what the grades mean, see pallet grades explained.
Downtime: 10:40 to 11:05, 25 minutes, nail gun compressor down, maintenance called. That one line explains most of the shortfall on A's.
The numbers worth calculating
Keep the math to what someone will act on.
| Metric | Formula | Example |
|---|---|---|
| Units per hour (per worker) | Total units / hours worked | 221 / 8 = 27.6 |
| % of target | Actual / target x 100 | 367 / 400 = 92% |
| Rework rate | Rework / total units x 100 | 12 / 639 = 1.9% |
| Downtime share | Downtime minutes / shift minutes x 100 | 25 / 480 = 5.2% |
Units per hour is also the number most piece rate plans and productivity reviews start from. If you pay by the piece, see piece rate pay for how the count turns into pay.
Where paper daily reports break
The template is easy. Filling it in is where the hours go:
- Each worker keeps a tally sheet, and someone adds every sheet up after the shift before the report can even start.
- Nobody sees the shortfall until the report is done, which is after the shift, when it is too late to move people.
- Sheets go missing or are unreadable, and the report goes up with a guess in it.
- The person who does the paperwork is out, and the report does not get done at all.
That last one is a common reason teams move off paper: the report depended on one person's afternoon.
How to get the report without adding up sheets
Count on the floor's phones instead, so the totals add up as people work:
- A group for each worker, with a counter for each product or grade. Use the same counter names in every group so the totals add up.
- Each unit goes in with a tap as it is finished, on the worker's own phone or a shared phone at the station.
- The Totals tab shows one live total per product across every worker, so the supervisor sees the shortfall at 11:00, not at 15:30.
- On Pro and Enterprise, a watch-only live view puts the totals on a floor TV as a production board. A watch-only screen needs no seat.
- On Pro, the day's totals per worker and per product export as CSV or JSON, or are emailed to the office at a set time. That export is the output section of the report, already added up.
Downtime notes, targets, and the sign-off stay with the supervisor. The counting, which is the part that took hours, is done.
For the full floor setup, see production counts per worker. If you are moving off paper one step at a time, from tally sheet to live count covers when to keep the sheet and when to switch.
Evidence and limitations
The template and metrics are standard production reporting practice; adapt the columns to what your floor actually makes. The example day is illustrative, not customer data.
SnapCount counts by manual taps only: no machine, PLC, or sensor connection, no barcode scanning, and no camera counting. It is not an MES: it has no work orders, downtime tracking, or OEE, and it does not track hours. It replaces the paper tally sheet behind the report, not the report's judgment calls.
Updated October 12, 2026.
Frequently asked questions
What should be included in a daily production report?
The date and shift, the site or line, units produced per worker and per product, the target and the variance, rejects or rework, downtime with its reason, notes on issues, and a supervisor sign-off.
What is the difference between a production log and a daily production report?
A production log is the running record through the day, often entry by entry. A daily production report is that log added up for the day, compared with the target, and signed off for whoever asked for it.
How do you calculate units per hour?
Divide the units a worker or line produced by the hours worked. For example, 221 units in 8 hours is 27.6 units per hour.
How do I make a daily production report in Excel?
Make one row per worker and one column per product, add a total column and a total row with SUM, and add a target table that subtracts actual from target. Copy the template above as your starting layout.
Can I get the daily production report without adding up tally sheets?
Yes. If each worker counts on a phone into a shared live count, the totals per worker and per product add up as they work, and the day's totals can be exported as a CSV that becomes the output section of the report.
Topics: daily production report, production report template, production log, units per hour, production tally sheet
About SnapCount Team
The SnapCount Team builds and tests shared counting workflows for events, inventory, attendance, and field work. We review these articles when product workflows change and link to the tools we use to validate them.
Contact SnapCount support